






Murder is down, and 5 427 people were still killed in three months
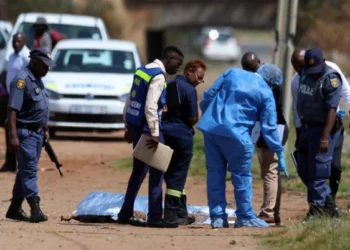
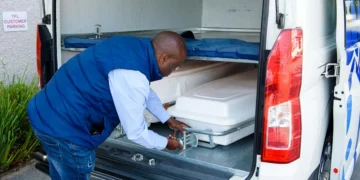
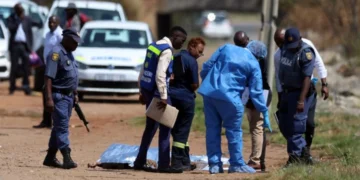
Murder fell 5,9% in the three months to June. The first quarter crime statistics South Africa published on 28 August 2026 record 5 427 murders between April and June, down from 5 770 in the same quarter a year earlier. That is 343 fewer deaths, and it works out to roughly 60 people killed a day.
Acting Police Minister Firoz Cachalia and Acting National Police Commissioner Lieutenant General Puleng Dimpane released the figures in Pretoria. SAPS counts crime by the state financial year, which starts on 1 April, so this quarter is the first of 2026/27.
The headline numbers
| Category | April to June 2025 | April to June 2026 | Change |
|---|---|---|---|
| Murder | 5 770 | 5 427 | Down 5,9% |
| Contact crime, all categories | 145 446 | 142 112 | Down 2,3% |
| Sexual offences | 11 630 | 11 532 | Down 0,8% |
| Robbery with aggravating circumstances | 31 475 | 26 839 | Down 14,7% |
| Trio crimes | 13 116 | 10 960 | Down 16,4% |
| Carjacking | 4 657 | 3 811 | Down 18,2% |
| Robbery at residential premises | 5 360 | 4 416 | Down 17,6% |
| Robbery at non-residential premises | 3 099 | 2 733 | Down 11,8% |
Trio crimes are carjacking, house robbery and business robbery counted together, which is why those three lines add up to the trio figure. Truck hijacking fell 21%.
The decreases are real but they are not uniform. Cachalia said the police are concerned about categories that increased over the quarter, particularly those affecting women and children, and named gender-based violence and femicide as needing urgent attention. Reporting on the release said attempted murder and assault both rose. SAPS did not publish those two case counts in its media statements.
What the police did during the quarter
The enforcement numbers give a sense of the scale of operations behind the decline.
- More than 440 000 high-visibility patrols and more than 520 000 stop-and-search operations under Operation Shanela, plus 3 494 roadblocks.
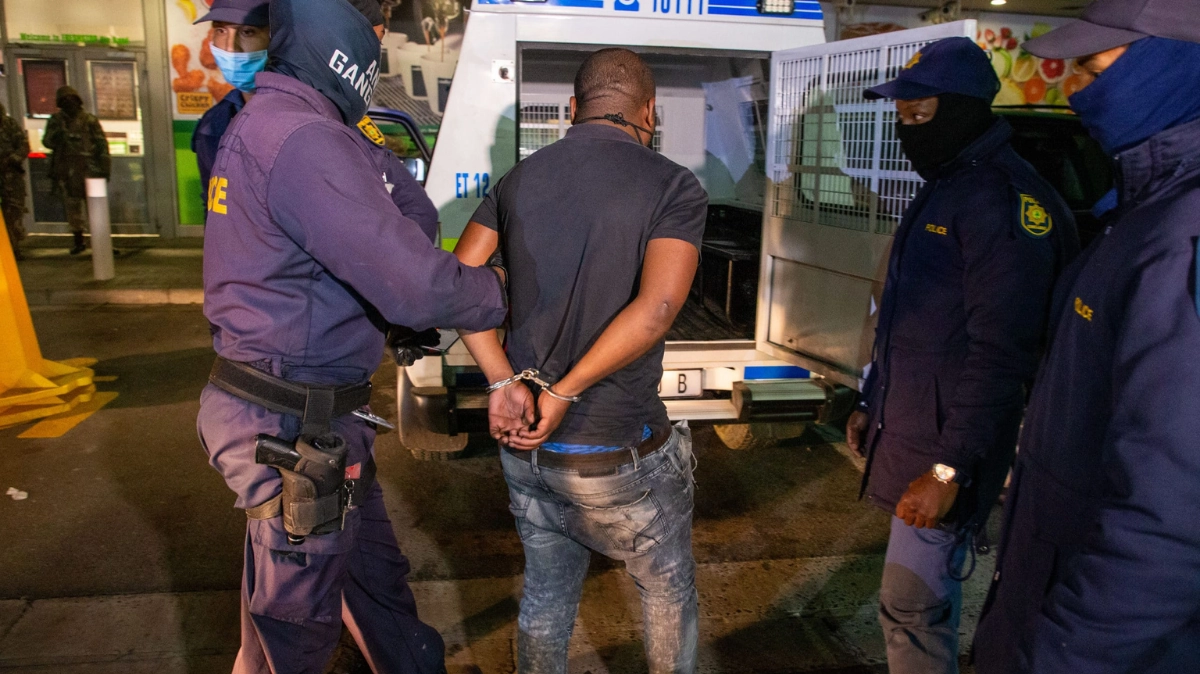
- 171 986 suspects arrested, including 28 475 wanted suspects linked to murder, attempted murder, rape, other sexual offences and illegal firearms.
- 1 618 arrests for murder, 1 581 for attempted murder, 1 935 for rape and 16 503 for assault with intent to inflict grievous bodily harm.
- 1 583 illegal firearms seized, including 1 300 handguns and 136 rifles, with 27 053 rounds of ammunition.
- 29 548 arrests for drug possession and 4 594 for dealing.
- 9 813 motorists arrested for driving under the influence, and 6 529 liquor premises closed.
- 780 hijacked and stolen vehicles recovered.
Crime is concentrated, not spread evenly
The single most useful thing in this release is not the national percentage. It is that a small number of police precincts account for a disproportionate share of violent crime.
Ministers and provincial MECs for community safety agreed at their MinMEC meeting to prioritise interventions at 140 high-crime police station precincts. Dimpane said crime intelligence is being repurposed to direct resources at those areas rather than spreading them thinly.
For a household deciding where to live or how to secure a property, the station-level tables matter more than the national trend. A 5,9% national drop tells you very little about your street. SAPS publishes station-level data with each quarterly release, and it is the layer to look at.
The ranking that says the opposite
A separate set of numbers circulated in the same week and appears to contradict all of this. Numbeo’s 2026 mid-year Crime Index has been reported as placing five South African metros in the world’s ten most dangerous cities, with Pretoria first, Pietermaritzburg third, Johannesburg fifth, Durban sixth and Gqeberha eighth.
The two do not measure the same thing, and it is worth being precise about that.
SAPS figures are recorded cases. They count dockets opened, which means crimes that were reported to police. Numbeo’s index is crowdsourced, built from voluntary online responses about how safe people feel. It is a perception measure, and its sample is self-selected rather than representative. It is not an official statistic and it is not comparable to police-recorded data.
So both can be accurate at once. Recorded violent crime can fall while people feel no safer, particularly where under-reporting is high. Neither number should be read as the whole picture.
What this means for you
- If you are hijacked or robbed, report it. Under-reporting is what makes recorded statistics diverge from lived experience, and an unreported case never reaches the station-level analysis that drives deployment.
- Check the station data for your own precinct rather than the national average when you are assessing risk.
- Carjacking fell sharply, but 3 811 in a quarter is still a live risk on the Gauteng and KwaZulu-Natal corridors. Insurers price this in, as seen in the hijacking cover attached to popular models.
- If you need proof of a clean record for work, study or emigration, the process runs through SAPS, and a police clearance certificate has its own timelines.
- Mass shootings remain concentrated in specific areas, as in the Johannesburg shooting in which 12 people were killed.
Where to check
The South African Police Service publishes the full quarterly release, including provincial and station-level tables, at www.saps.gov.za under the crime statistics section. SAPS releases the data on a pre-announced schedule, roughly six weeks after the end of each quarter, which means the July to September figures are due around November 2026. Crime Stop is 08600 10111.